The HCC Surveillance Simulator is an interactive research and education tool for comparing model-projected outcomes across hepatocellular carcinoma (HCC) surveillance strategies in patients with cirrhosis. Users can explore how test performance, cost, adherence, liver disease etiology, and willingness-to-pay thresholds affect projected clinical outcomes, testing burden, lifetime costs, quality-adjusted life years (QALYs), and cost-effectiveness. Results are population-level estimates and are not intended to guide individual clinical decisions.
The simulator is based on an individual-level microsimulation model of cirrhosis and HCC progression. Simulated individuals begin with compensated cirrhosis and are followed over a lifetime horizon until death or age 100. The model uses monthly cycles to capture liver disease progression, HCC development, surveillance detection, diagnostic evaluation, treatment, mortality, costs, and quality-adjusted survival.
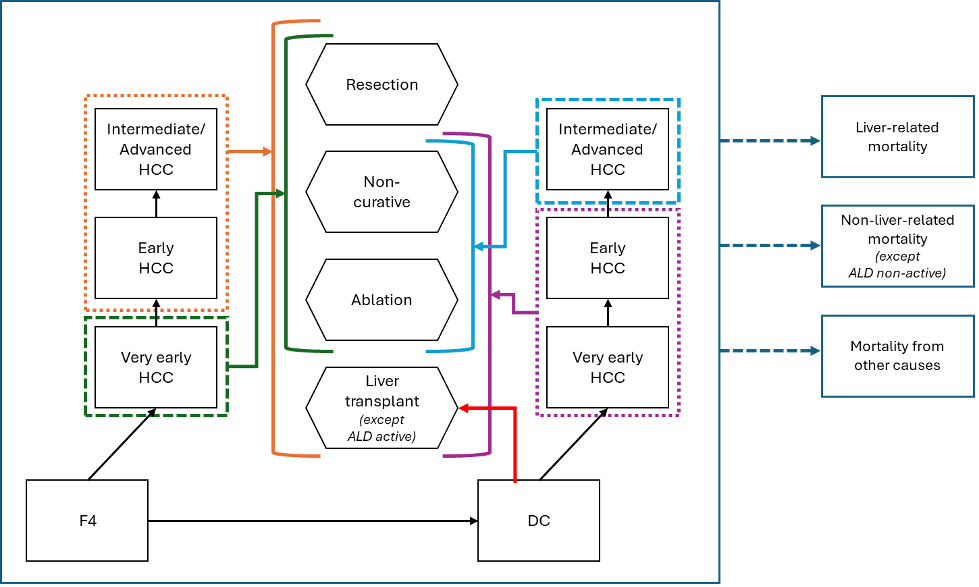
The model represents progression from compensated cirrhosis to decompensated cirrhosis and HCC. HCC is categorized as very early, early, or intermediate/advanced stage. Earlier detection can change treatment eligibility and downstream outcomes, including survival, costs, and QALYs. Disease progression and mortality are modeled using etiology-specific parameters where available, and all future costs and QALYs are discounted at 3% annually.
The base population consists of 50-year-old individuals with compensated cirrhosis. The overall cohort reflects a contemporary cirrhosis population with cured hepatitis C virus (HCV), metabolic dysfunction-associated steatotic liver disease (MASLD), and alcohol-associated liver disease (ALD), with ALD further divided into active and non-active drinkers.
In the overall cohort, the starting etiology distribution is 38.45% cured HCV, 30.08% MASLD, and 31.47% ALD, including 4.00% active drinkers and 27.47% non-active drinkers. Users can also view etiology-specific results for MASLD, cured HCV, ALD active drinkers, and ALD non-active drinkers.
The natural history model represents progression from compensated cirrhosis to decompensated cirrhosis and HCC. HCC is categorized into very early, early, and intermediate/advanced stages. Stage-specific detection affects downstream treatment allocation, survival, costs, and QALYs.
Disease progression and mortality are modeled using etiology-specific parameters where available. Liver-related mortality, non-liver-related mortality, and mortality from other causes are incorporated, with risks varying by liver disease stage, HCC status, age, and etiology.
The simulator compares no surveillance, ultrasound with alpha-fetoprotein (US+AFP), GALAD, HES V2.0, abbreviated MRI, MRI, and a user-defined custom strategy.
The accompanying study focused primarily on HES V2.0 and GALAD compared with US+AFP. The simulator presents these findings interactively and includes additional model-based scenarios to support broader exploration of surveillance trade-offs. These additional strategies should be interpreted as exploratory model outputs rather than clinical recommendations.
For biomarker-based and custom strategies, users can vary test sensitivity, specificity, test cost, and adherence assumptions supported by the model-output dataset. Baseline adherence reflects published real-world surveillance patterns: 25.2% no surveillance, 52.0% inconsistent surveillance, and 22.8% consistent biannual surveillance. Improved adherence scenarios represent higher surveillance participation for selected strategies.
Surveillance tests involve a trade-off between sensitivity and specificity. Sensitivity reflects the ability to identify HCC when HCC is present. Specificity reflects the ability to avoid abnormal results when HCC is not present.
A more sensitive test may detect more HCC cases at earlier stages, but if specificity is lower, it may also increase false-positive results and downstream MRI, CT, or biopsy procedures. Conversely, a highly specific test may reduce unnecessary follow-up testing but may miss opportunities for earlier detection if sensitivity is lower.
The simulator evaluates whether a given combination of sensitivity, specificity, test cost, and adherence improves health outcomes enough to justify its costs and testing burden.
Individuals with abnormal surveillance results undergo diagnostic evaluation using contrast-enhanced abdominal MRI or CT. Diagnostic results may be negative, positive, or inconclusive. Inconclusive findings can lead to additional imaging and, when necessary, liver mass or nodule biopsy.
This pathway links surveillance test performance to downstream resource use. Lower specificity can increase false-positive results and diagnostic testing, while higher sensitivity can shift detection toward earlier HCC stages. The clinical value of that shift depends on treatment eligibility, survival, quality of life, and costs.
The model includes direct medical costs for surveillance, diagnostic evaluation, liver disease management, HCC treatment, liver transplantation, and follow-up care. Costs are expressed in 2024 U.S. dollars.
Health outcomes are summarized using QALYs, which combine length of life and quality of life into a single measure. Cost-effectiveness is evaluated using lifetime costs, QALYs, and incremental cost-effectiveness ratios (ICERs). The ICER compares the additional cost of a strategy with the additional QALYs it produces. Users can adjust the willingness-to-pay threshold to examine whether strategies would be considered cost-effective under different decision thresholds.
The simulator is designed to help clinicians, researchers, and decision-makers compare how surveillance test performance and implementation assumptions affect projected clinical and economic outcomes.
The model represents patients with compensated cirrhosis at baseline. Surveillance is modeled as a repeated process over time, and abnormal surveillance results can trigger diagnostic imaging and biopsy. HCC stage at detection influences treatment allocation, survival, costs, and QALYs.
Base-case adherence follows published real-world patterns. Improved adherence scenarios explore how results may change if surveillance participation increases; they do not assume that patients necessarily prefer blood-based surveillance over imaging.
The user-defined custom strategy is intended for exploratory analysis of hypothetical test characteristics and should be interpreted as a model-based projection for the selected sensitivity, specificity, cost, and adherence assumptions.
The table below summarizes selected inputs relevant to interpreting the simulator results. These values provide context for the simulated population, liver disease progression, surveillance and diagnostic testing, costs, and health utilities. The table is not a complete list of all model parameters; simulator outputs reflect the full underlying model parameterization.
| Input category | Base-case value | Source |
|---|---|---|
| Starting population | ||
| Starting age and disease state | 50 years; compensated cirrhosis (F4) | |
| Etiology distribution | 38.45% cured HCV; 30.08% MASLD; 31.47% ALD | [1] |
| ALD subgroup distribution | 4.00% active drinkers; 27.47% non-active drinkers | [1] |
| Natural history and HCC progression | ||
| Annual probability of F4 to decompensated cirrhosis | MASLD 0.0411; HCV 0.0075; ALD active 0.1400; ALD non-active 0.1100 | [2–5] |
| Annual probability of F4 to very early HCC | MASLD 0.0141; HCV 0.0195; ALD 0.0083 | [6–10] |
| Annual probability of very early to early HCC | 0.5413 | [11–13] |
| Annual probability of early to intermediate/advanced HCC | 0.3251 | [11–13] |
| Surveillance adherence and test performance | ||
| Baseline surveillance adherence | 25.2% none; 52.0% inconsistent; 22.8% consistent biannual surveillance | [14] |
| US+AFP surveillance test performance | Sensitivity 0.63; specificity 0.84 | [15] |
| Diagnostic MRI test performance | Sensitivity 0.88; specificity 0.93 | [16] |
| Diagnostic CT test performance | Sensitivity 0.79; specificity 0.94 | [16] |
| Costs, 2024 U.S. dollars | ||
| Annual compensated cirrhosis cost | MASLD/HCV $7,361; ALD $6,758 | [17, 18] |
| Annual decompensated cirrhosis cost | MASLD/HCV $18,352; ALD $27,667 | [18, 19] |
| Health utilities | ||
| Compensated cirrhosis utility | MASLD 0.78; HCV 0.90; ALD 0.70 | [20–22] |
| Decompensated cirrhosis utility | MASLD 0.67; HCV 0.80; ALD 0.62 | [21, 23–24] |
The simulator provides population-level projections and is not intended to guide individual surveillance decisions. Individual decisions should consider patient-specific risk factors, comorbidities, imaging quality, transplant eligibility, local practice patterns, and clinician judgment.
The model focuses on patients with compensated cirrhosis at baseline. Results may not apply to patients without cirrhosis, patients with earlier fibrosis stages, or populations with substantially different HCC risk, adherence, diagnostic access, treatment availability, or mortality patterns.
Some strategies represent exploratory scenarios rather than directly observed clinical pathways. Improved adherence scenarios are hypothetical and may depend on access, insurance coverage, provider adoption, patient education, and health system capacity.
As with all model-based analyses, results depend on model structure and input data. The simulator should be used to understand trade-offs across strategies rather than to generate definitive predictions for a specific clinical setting.